Highlighted Water Indicators
|
Aquatic FragmentationAquatic fragmentation in a watershed or hydrologic region. When streams are crossed by roads or dams, the portions above and below the potential barrier are separated from each other in a process called fragmentation. This can interfere with physical processes and movement of aquatic organisms. |
|
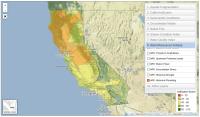
Baseline Water Stress (WRI)Baseline water stress measures total annual water withdrawals (municipal, industrial, and agricultural) expressed as a percent of the total annual available flow. Higher values indicate more competition among users. This indicator was used by the World Resources Institute in the Aqueduct 2.0 project. |
Ecological FootprintThe Ecological Footprint (EF) is a measure of the amount of biological productive land and sea area are required to meet the consumption and waste production patterns of a population or human process. |
|

|
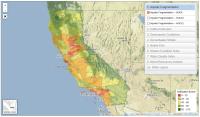
Groundwater NitrateGroundwater describes water in soil and sub-soil substrates (e.g., aquifers) that is replenished across various time-frames by surface water that percolates to these underground reservoirs. For this water to be useable to meet human needs (e.g., drinking, irrigation) it must meet the same kinds of water quality requirements as surface water. One indicator of groundwater quality is nitrate concentration. |
|
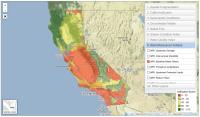
Groundwater: CalEnviroScreenCalifornia Communities Environmental Health Screening Tool ("CalEnviroScreen") is intended to support assessments of the potential environmental pollution effects on communities, including disadvantaged communities, in order to support reduction in disparities and threats to health. The groundwater component of CalEnviroScreen provides a relative ranking of communities' groundwater condition and so should not be considered an absolute indication of health risk or cumulative effects. |
|
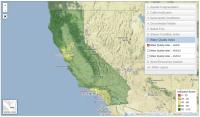
Historical Drought Severity (WRI)Drought severity measures the average length of droughts times the dryness of the droughts from 1901 to 2008. The indicator was used by the World Resources Institute in the Aqueduct 2.0 project. |
|
Historical Flooding Occurrence (WRI)Flood occurrence is the number of floods recorded from 1985 to 2011. The indicator was used by the World Resources Institute in the Aqueduct 2.0 project. |

|
Impervious Surface: Geomorphic ConditionProportion of watershed covered by impenetrable materials such as roads, parking lots, and buildings preventing water from leaching directly into the soil. The greater the proportion of watershed with impervious surfaces, the greater the likelihood of geomorphic processes and conditions being degraded due primarily to modifications of stormwater runoff dynamics. |
|
Impervious Surface: Water Quality IndexProportion of watershed covered by impenetrable materials such as roads, parking lots, and buildings preventing water from leaching directly into the soil. Water quality is affected by impervious surface development in watersheds. The more impervious surfaces are developed, the greater the chance that water quality will be degraded. |

|
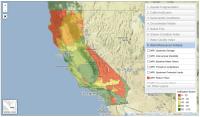
Inter-annual Variability (WRI)Inter-annual variability measures the variation in water supply between years. This indicator was used by the World Resources Institute in the Aqueduct 2.0 project. |

|
Native Fish CommunityRatio of observed to expected native fish species in a waterbody or watershed. Fish indicators have been widely used and recognized as important tools to evaluate watershed and stream ecosystem health. |
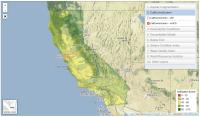
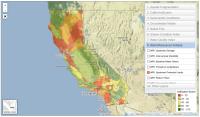
Plant Growth IndexThe Plant Growth Index (PGI) is a measure of long-term changes in plant community condition, based on satellite measurement of the peak annual Normalized Difference Vegetation Index. You can click on "Map Layers" items to the right of the map view to display them in the map. It is possible to turn on more than one map at a time. See more detail below the map view. |
|
Public support and awareness of water system protectionPublic awareness and perceptions of the role water plays in their lives and in the environment can affect how people vote to support candidates, taxes/assessments, and bond issues. It is both important to keep the public informed to support democracy and to track their knowledge and perceptions in order to develop policies and management actions. |
|
|
Return Flows (WRI)Return flow ratio measures the percent of available water previously used and discharged upstream as wastewater. This indicator was used by the World Resources Institute in the Aqueduct 2.0 project. |
|
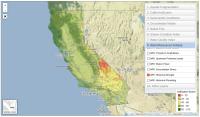
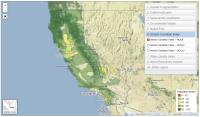
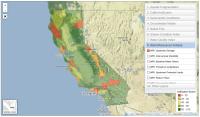
Stream Condition IndexThis is a biological index, composed of indicators & metrics representing the condition of the benthic invertebrate communities living in streams and rivers. The presence and abundance of aquatic plants and animals can provide an indication of waterway and landscape disturbance, geomorphic conditions, appropriate water availability, and water quality. Comparing the measured presence (observed) of native species or groups to the expected presence of these species or groups is one way of measuring watershed and waterway conditions. |

|
Threats to Amphibians (WRI)Threatened amphibians measures the percentage of amphibian species classified by IUCN as threatened. The World Resources Institute used this indicator in the Aqueduct 2.0 project. |
|
Upstream Protected Lands (WRI)Upstream protected land measures the percentage of total water supply that originates from protected ecosystems. Modified land use can affect the health of freshwater ecosystems and have severe downstream impacts on both water quality and quantity. The World Resources Institute used this indicator in the Aqueduct 2.0 project. |
|
Upstream Storage (WRI)Upstream storage measures the water storage capacity available upstream of a location relative to the total water supply at that location. The World Resources Institute used this indicator in the Aqueduct 2.0 project. |
Water FootprintThe water footprint is the sum of the water used directly or indirectly to produce goods and services consumed by humanity. Agricultural production accounts for most of global water use, but drinking, manufacturing, cooking, recreation, washing, cleaning, landscaping, cooling, and processing all contribute to water use. |